Research / Validation / Deployment
Systematic alpha,
engineered to operate
while you don't.
Nine broker-validated systems across indices, FX and crypto — one controlled institutional execution layer that never sleeps and never improvises.
Scroll to enter the system
Move from thesis to system architecture, then into the live portfolio and validation stack.
Operating Thesis
Portfolio logic before platform theatrics.
Session Coverage
Tokyo -> London -> New York
System Stack
7 independent models
PF
0.00
DD
0.0%
Trades
695+
System Snapshot
The thesis should be visible before the first scroll.
Validated EAs
09
Survivors of 113 candidates
Backtests
199
Engine + broker. Proven twice.
Rejection Rate
92%
104 strategies killed
OOS Decay
1.04
Out-of-sample. Zero degradation.
Thesis 01
Validated through rejection: 104 of 113 strategies were killed.
Thesis 02
Two-layer proof: research engine plus broker-data Strategy Tester.
Thesis 03
Audited independently — defects published, not hidden.
Thesis 04
Out-of-sample evidence before capital, not after.
00 / The System
Four layers. Zero improvisation.
Hover to open each layer of the stack.
Validation Funnel
113 ideas in. Nine systems out.
The edge is not only in what survives — it is in what gets eliminated. Every strategy faces the research engine, then the broker's own bars, then full-history stress.
Detail 01
113 strategies catalogued from 28 families
Detail 02
199 backtests across two independent layers
Detail 03
92% rejection rate before capital allocation
Highlight metric
104
Execution Forensics
Bugs are hunted, not hidden
An audit traced dead strategies to a midnight session-break defect: orders fired at the daily bar open and died with 'market closed'. The fix resurrected two systems from zero trades.
Detail 01
Order-retry layer added without touching strategy logic
Detail 02
Two EAs went from 0 trades to fully measurable
Detail 03
Findings published in the remediation log
Highlight metric
02
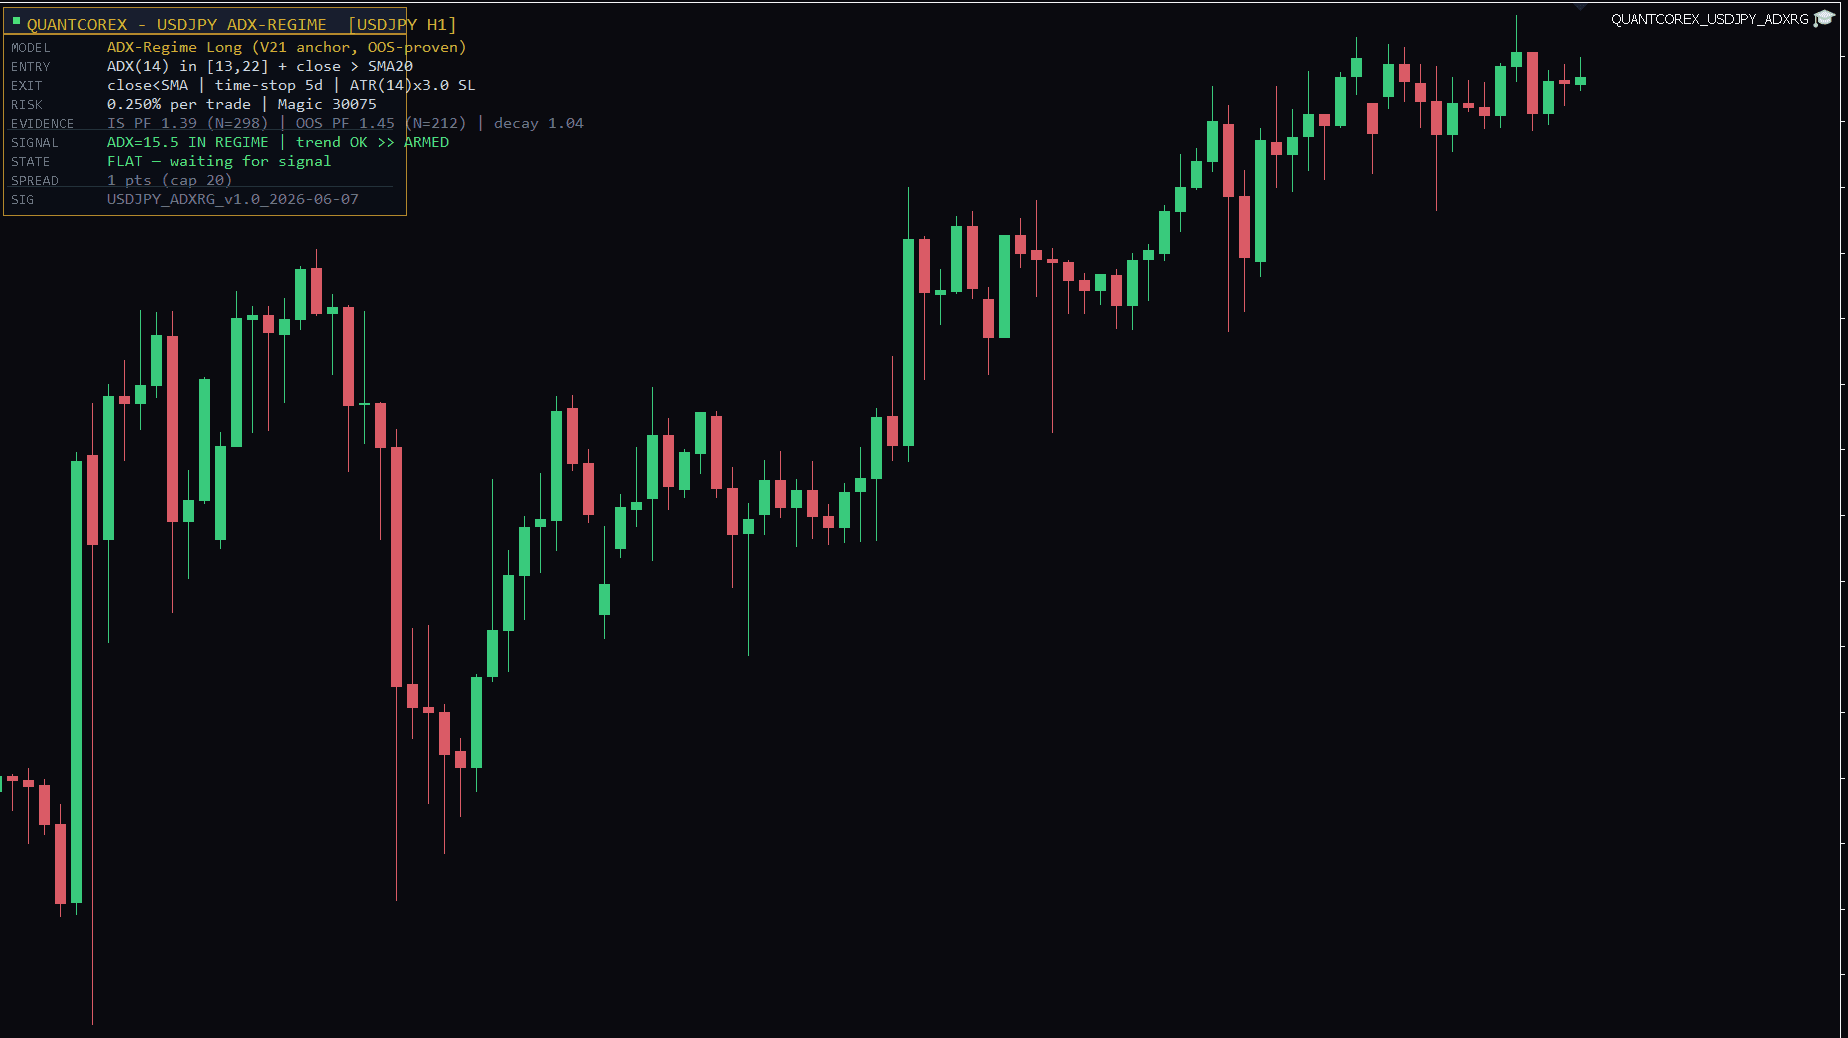
Out-of-Sample Proof
The anchor passed the only test that matters
USDJPY ADX-Regime H1: 298 in-sample trades, then 212 out-of-sample trades on unseen data. The out-of-sample profit factor came back HIGHER than in-sample.
Detail 01
IS PF 1.39 (2023-04 to 2024-12)
Detail 02
OOS PF 1.45 (2025-01 to 2026-04)
Detail 03
692 trades on the full 2022+ window, PF 1.63
Highlight metric
1.04
Risk Engine
Cluster risk as architecture
Correlated dip-buyers share one position budget enforced in code. Three EAs buying the same S&P dip is one bet, not three — the system treats it that way.
Detail 01
Max 2 concurrent positions per strategy cluster
Detail 02
0.125% base risk per trade, halved on probation systems
Detail 03
Worst-case simultaneous exposure: 0.875% of equity
Highlight metric
0.875%
01 / The Problem
Humans break before markets do.
Discipline fails exactly when it is needed most. So we removed it from the loop.
Session Sequence
Asia accumulates. London sweeps. New York distributes.
Asia
Accumulation
Range building before directional intent.
London
Manipulation
Liquidity sweep through the resting extremes.
New York
Distribution
Expansion away from the engineered sweep.
You can't monitor 7 instruments across 3 sessions.
You can't execute at 3am.
You can't remove emotion.
You can't keep decision quality constant under fatigue.
You can't rebalance risk across regimes with intuition alone.
02 / The Edge
Not one model. Nine proven systems.
Each engineered for one behaviour. Each forced to survive the broker's own data.
Systems
9
Distinct logic stacks for distinct regimes.
Families
5
Reversion, regime, breakout, sweep, momentum.
Risk Engine
1
Capital allocated as a coordinated system.
Coverage
24h
One mandate across the global liquidity clock.
03 / Anatomy of a Trade
Not a belief. A sequence.
Five live families. One chart each. This is what the machines actually trade.
RSI-2 Mean Reversion
Buys short-term panic above the 200-day average. Sells the bounce. Sixty-nine percent of the time, the market obliges.
04 / Validation
113 in. Five survive.
92% of everything we built was killed before touching capital.
ADX-regime D1
0 / 28 configs
DE40 reversion
PF 0.99 broker
UK100 IBS
PF 1.05 · 4.3y
TPS-3 standalone
100% = RSI-2
XAUUSD ×12
12 families dead
RSI-3 US500
PF 1.00 full
A research process that never rejects anything is a marketing process.
05 / Portfolio
The system view is the product.
Nine instruments. One risk engine.
Core Book PF
1.59
Deploy-Grade EAs
5 / 9
Worst-Case Risk
0.875%
USDJPY
ADX-Regime · H1
PF
1.41
Win Rate
28.8%
Risk
0.125%
Expectancy
0.29R
Avg R:R
3.49
Max DD
2.33%
510 closed trades / hover reveals system diagnostics
US500
RSI-2 Reversion
PF
2.92
Win Rate
69.4%
Risk
0.125%
Expectancy
0.59R
Avg R:R
1.29
Max DD
0.26%
36 closed trades / hover reveals system diagnostics
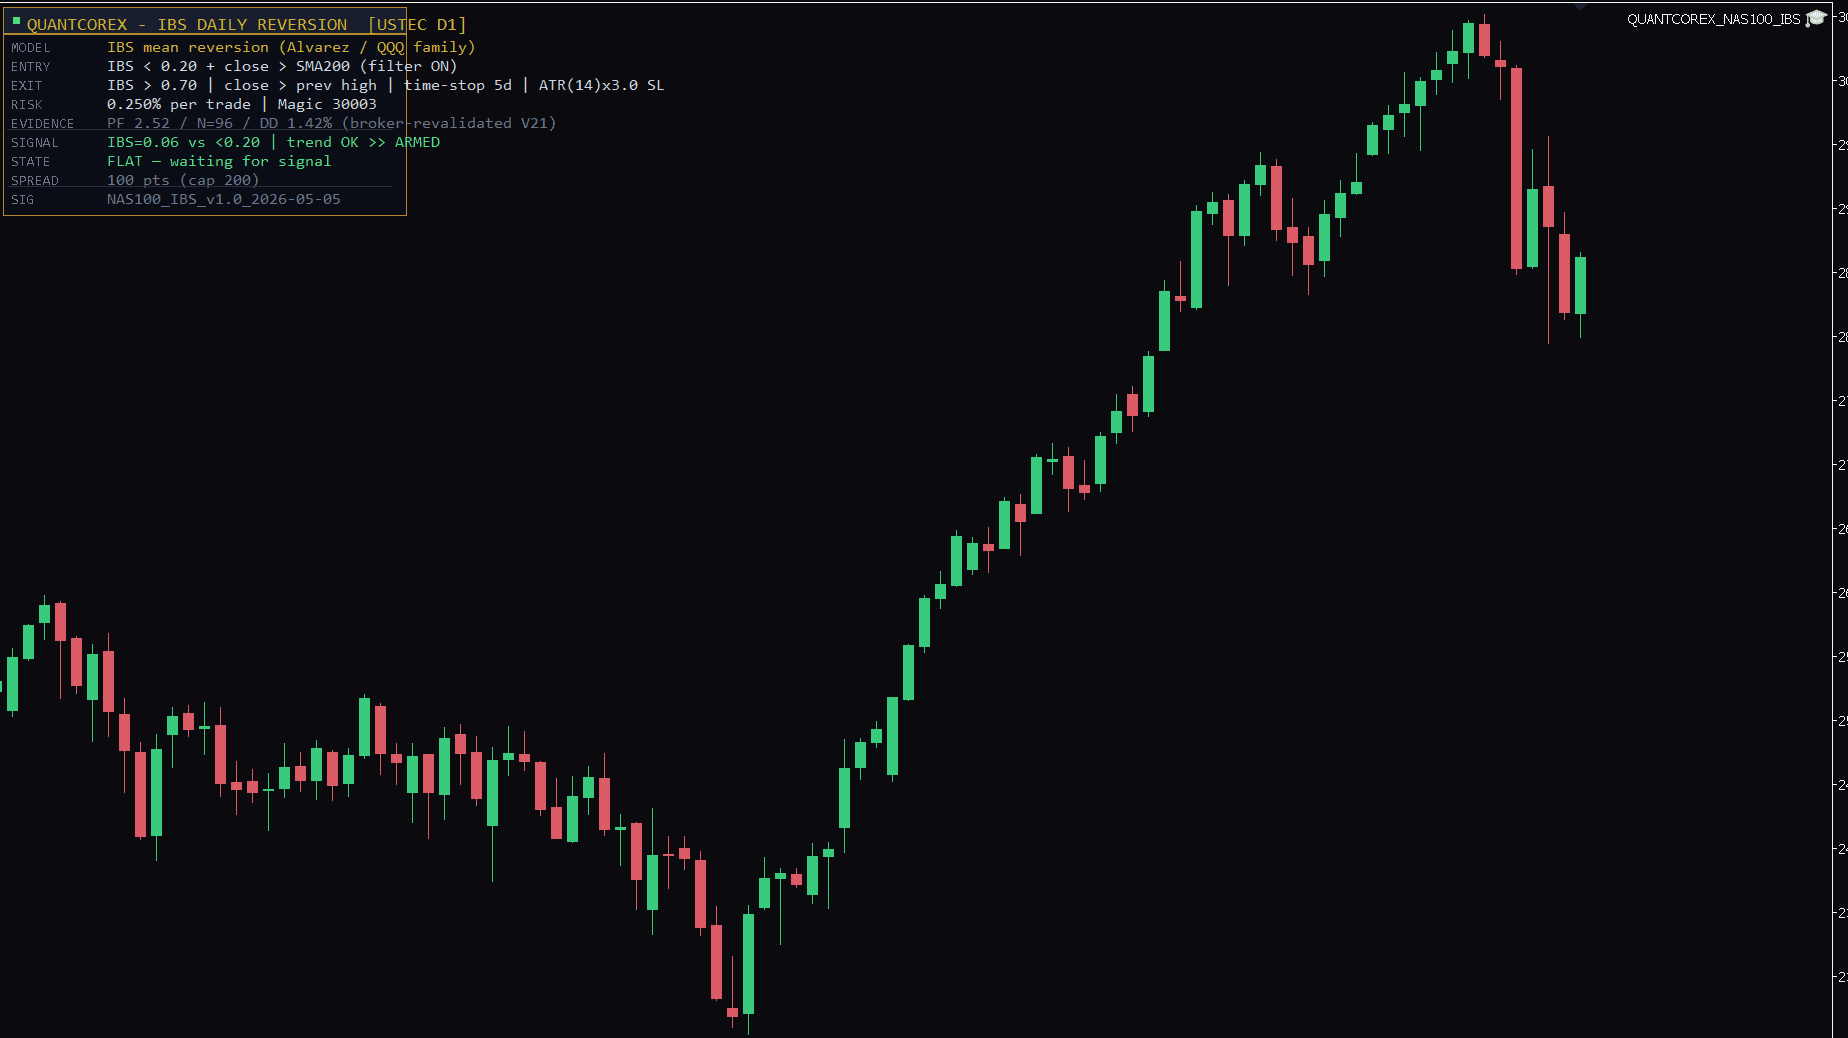
NAS100
IBS Daily Reversion
PF
2.52
Win Rate
74.0%
Risk
0.125%
Expectancy
0.40R
Avg R:R
0.89
Max DD
1.42%
96 closed trades / hover reveals system diagnostics
GBPUSD
RSI-2 Pullback · H4
PF
1.34
Win Rate
64.5%
Risk
0.125%
Expectancy
0.12R
Avg R:R
0.74
Max DD
1.56%
214 closed trades / hover reveals system diagnostics
NAS100
Donchian 30/15 Breakout
PF
1.93
Win Rate
52.2%
Risk
0.125%
Expectancy
0.44R
Avg R:R
1.77
Max DD
2.62%
23 closed trades / hover reveals system diagnostics
NAS100
RSI-3 Triple Bottom
PF
2.13
Win Rate
66.7%
Risk
0.125%
Expectancy
0.38R
Avg R:R
1.07
Max DD
1.51%
18 closed trades / hover reveals system diagnostics
NAS100
Composite-RSI
PF
1.70
Win Rate
62.5%
Risk
0.125%
Expectancy
0.26R
Avg R:R
1.02
Max DD
2.29%
40 closed trades / hover reveals system diagnostics
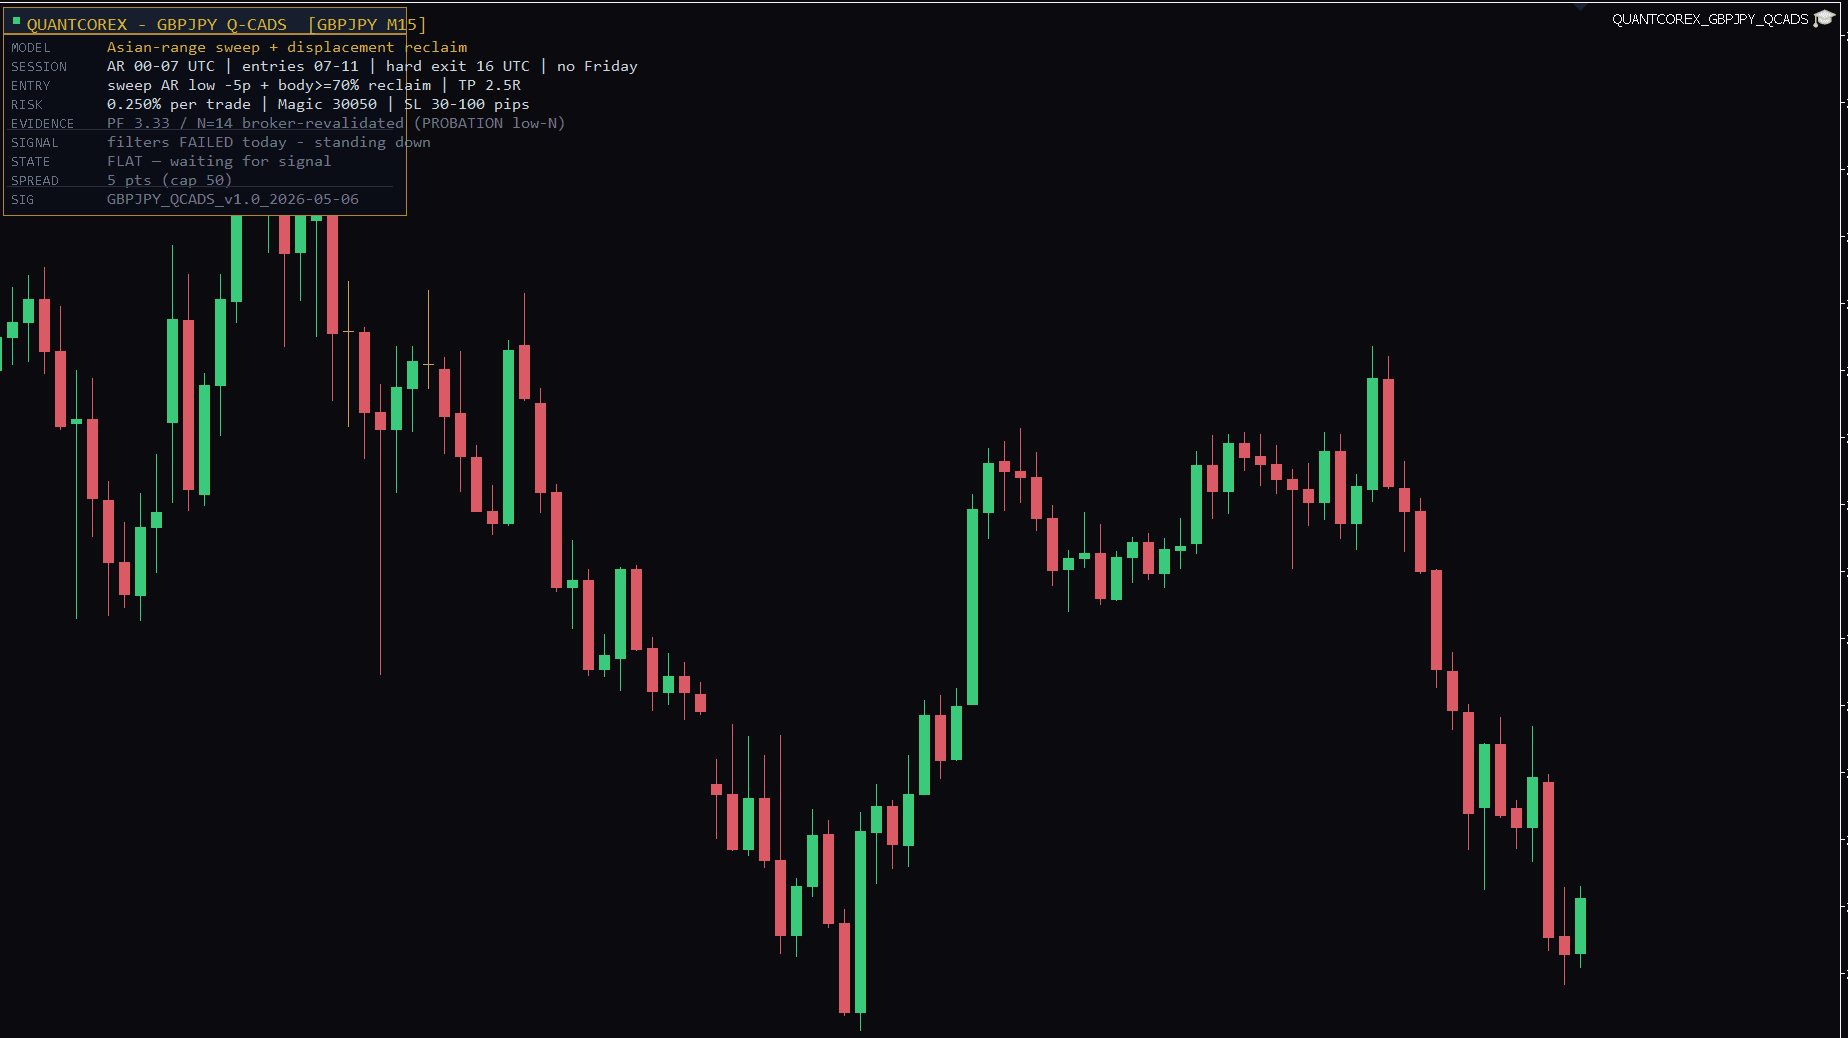
GBPJPY
Q-CADS Stat-Arb
PF
3.33
Win Rate
71.4%
Risk
0.075%
Expectancy
0.67R
Avg R:R
1.33
Max DD
0.68%
14 closed trades / hover reveals system diagnostics
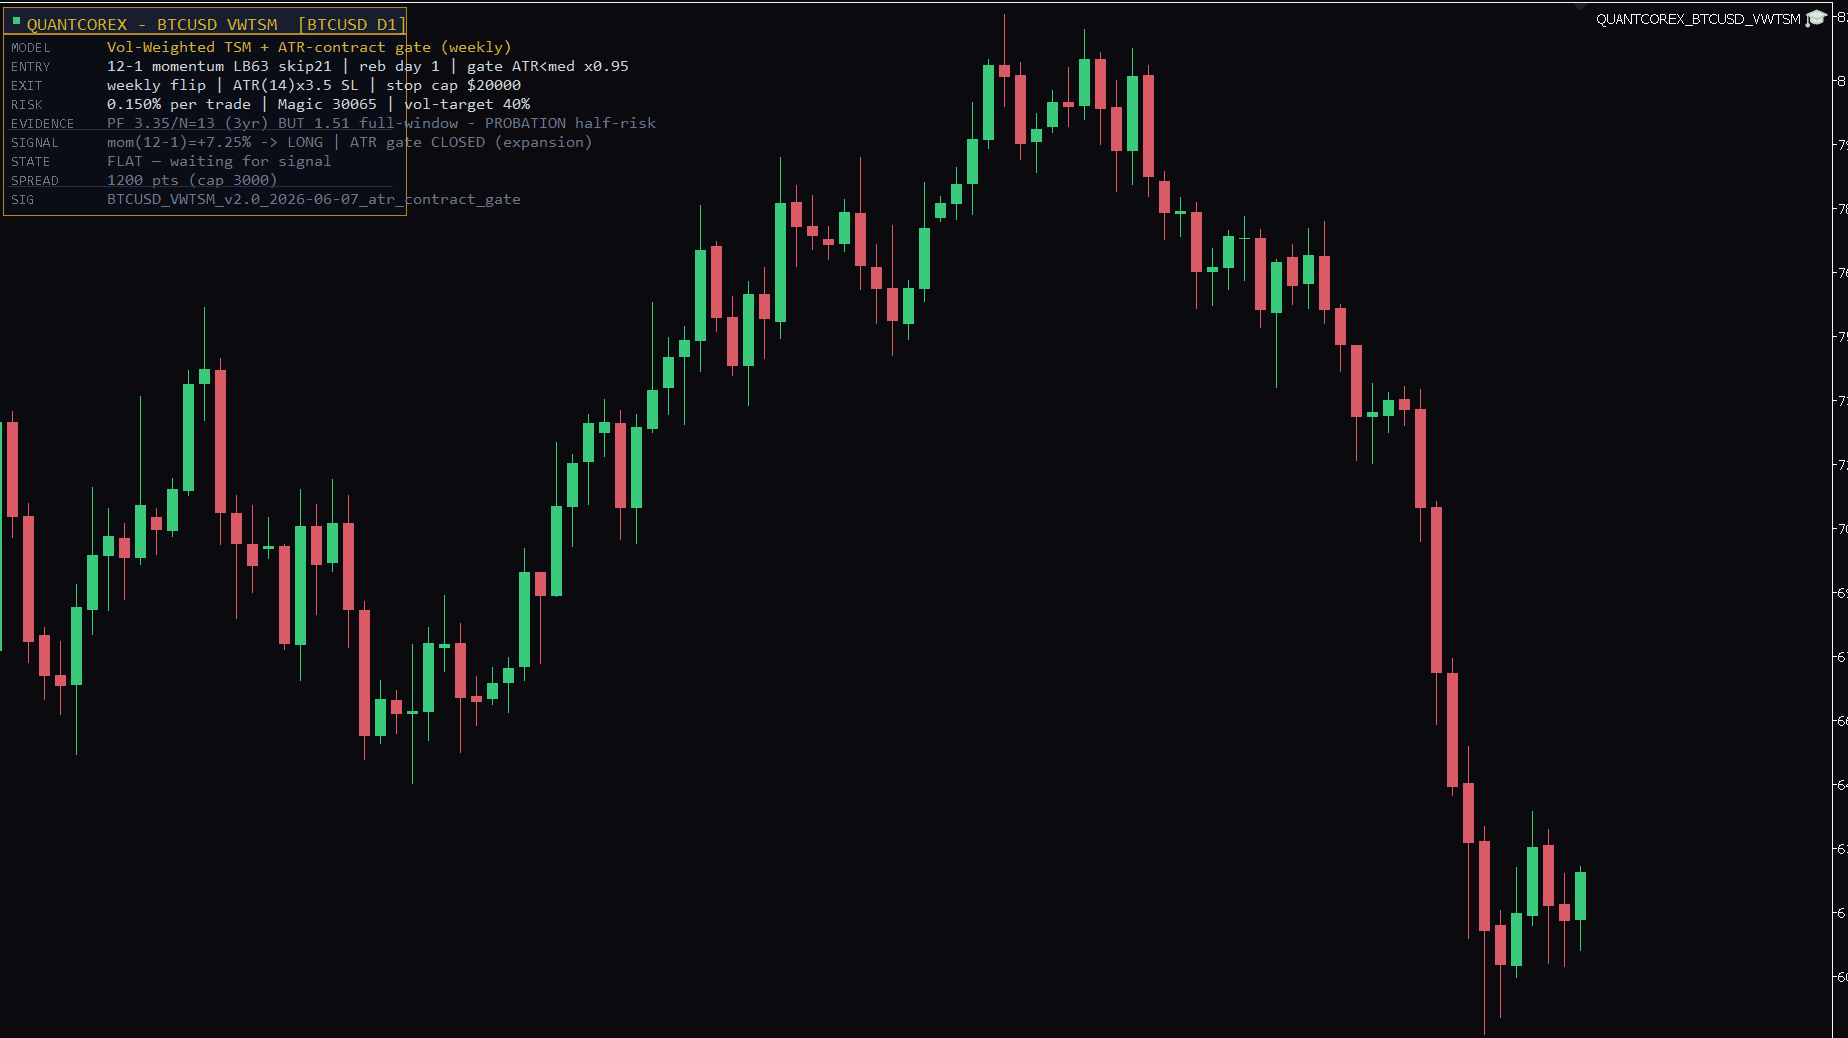
BTCUSD
VWTSM Momentum
PF
3.35
Win Rate
62.0%
Risk
0.075%
Expectancy
0.89R
Avg R:R
2.05
Max DD
4.76%
13 closed trades / hover reveals system diagnostics
06 / Risk
Survive first. Scale second.
Per trade. Per cluster. Per portfolio. Capped in code, not in promises.
Exposure Grid
0.25% per trade.
Never all-in.
Built to survive.
Session separation prevents the portfolio from unintentionally stacking the same risk expression into one market window. Capital is sized to absorb adverse periods without compromising the operating system.
07 / Live Deployment
Not a backtest. A terminal.
Captured live on the broker's MetaTrader 5 — each machine reporting its own model, evidence and state. Two armed. Two standing down. That is the discipline.
IC Markets demo · captured 11 Jun 2026 · panels render their own state — no retouching
08 / Performance
Consistency over spectacle.
4.3 years of broker data. Proven out-of-sample.
Portfolio Quality
0.00
Portfolio profit factor
Validated Window
4.3 Years
Full broker history 2022-2026, bear tail included
OOS Track
16 Months
USDJPY anchor: OOS PF 1.45 vs IS 1.39 — decay ratio 1.04
Max Core-EA DD
2.62%
Worst drawdown across the five deploy-grade systems
Equity Curve
Portfolio aggregate / 36 months
Out-of-Sample
Forward track after development window
09 / Position
Systematic alpha.
Engineered. Controlled. Repeatable.
Systematic
Engineered
Controlled
Repeatable
Access
For serious capital, the interface should be as disciplined as the system.
Request a private walkthrough, review the portfolio architecture, or open a direct conversation around deployment and allocation.